Suppliers to the public sector value honesty and integrity.
Almost all suppliers (98%) agree that ‘behaving with honesty and integrity is important to me’ and 93 per cent ‘agree’ or ‘strongly agree’ that they know what behaviour constitutes corruption.
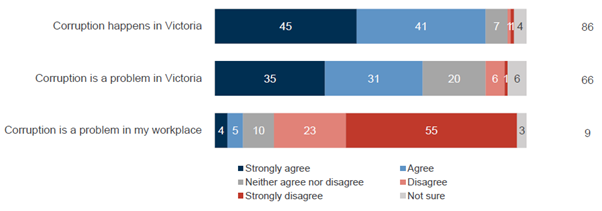
Most suppliers agree that corruption happens in Victoria.
Most suppliers (86%) agree that corruption happens in Victoria. Perceptions that corruption happens in Victoria are significantly higher among those who have tendered for work in the commercial (93%) or construction sectors (92%) and among those who have won local government work (90%). While 66 per cent agree that corruption is a problem in Victoria, only 9 per cent agree that it is a problem in their workplace.
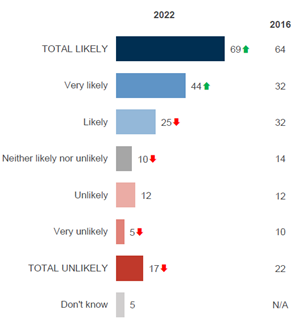
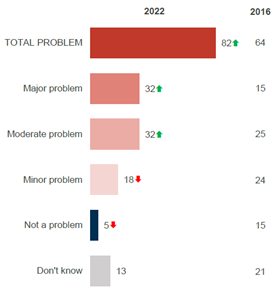
More than four in five suppliers think that corruption in public sector procurement is a problem.
Thirty-two per cent of suppliers think corruption is a ‘major’ problem in procurement, with the same proportion also considering it to be a moderate problem. Suppliers who have tendered for work in the construction (44%) and commercial sectors (40%) are significantly more likely to consider it to be a major problem, as do those who have not won contract work (46%). There has been a significant increase in the per cent who consider it to be a problem in 2022 (82%) compared to 2016 (64%).
A third of suppliers claim concerns about corruption led them not to bid for work.
While 82% of suppliers consider corruption in public sector procurement to be a ‘major’ or a ‘moderate’ problem, in the main, this perception does not prevent them bidding for work (62% state their view has not changed their decision to bid on work). However, 34 per cent have decided not to bid on at least one occasion in the last 12 months due to concerns about possible corruption or misconduct. This is consistent with the findings from the 2016 survey with business suppliers.
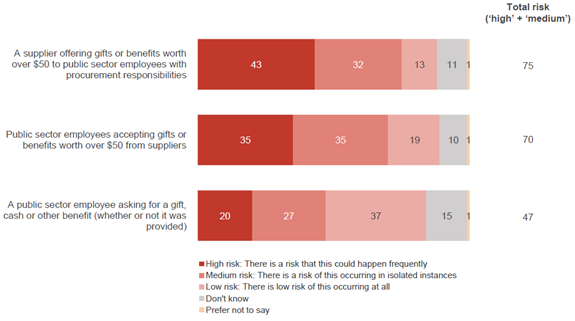
Gifts and benefits are more likely to be offered by suppliers than asked for.
Three quarters of suppliers (75%) think there is a ‘medium’ or ‘high’ risk of suppliers offering gifts or benefits worth over $50 to public sector employees with procurement responsibilities. The perceived risk that public sector employees would ask for a gift is much lower (47%).
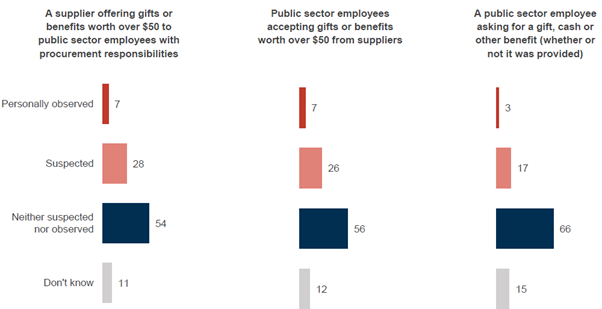
Instances of suppliers personally observing public sector employees accepting or asking for a gift is low.
While 26 per cent have suspected public sector employees of accepting gifts or benefits worth over $50 from suppliers, only 7 per cent have personally observed this in the last 12 months. Fewer have suspected public sector employees of asking for a gift, cash, or other benefit (17%) or personally observed this (3%).
Those who have not bid due to corruption concerns are significantly more likely to report having personally observed or suspected these improper behaviours occurring (56% suspected or observed public sector employees accepting gifts or benefits worth over $50 from suppliers, 40% suspected or observed employees asking for a gift, cash, or other benefit). Suppliers who have tendered for work in the construction (44%) and commercial sectors (40%) also reported a significantly higher incidence of ‘suspecting’ or ‘personally observing’ each of the improper behaviours.
Few business suppliers state they have offered a public sector employee a benefit worth more than $50.
Three per cent of suppliers have offered a public sector employee a benefit worth more than $50 in the last 12 months. This is significantly higher among suppliers with more than 200 employees (7%). By comparison, in 2016, five per cent of business suppliers stated they had offered a public sector official a gift, cash or other benefit in the past 12 months.
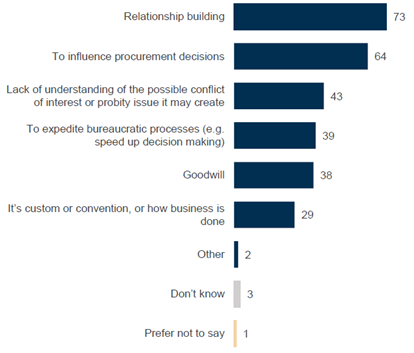
Gifts and benefits are said to be offered mostly due to relationship building (73%) and to influence procurement decisions (64%).
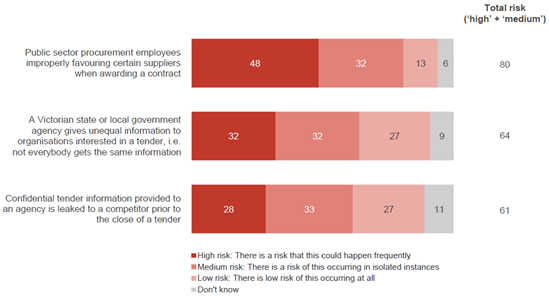
The highest perceived risks are for favouritism or unequal information in tender processes.
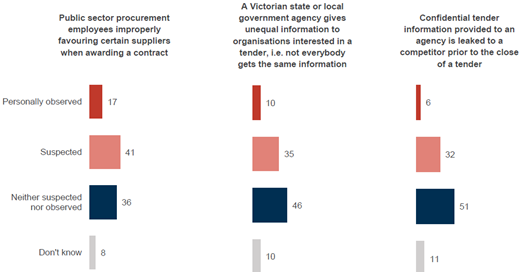
The ‘high risk’ of improper behaviours occurring is considered greatest for favouritism toward certain suppliers when awarding a contract (80% consider this to be a ‘high’ or ‘medium’ risk) –17 per cent of suppliers indicated they have personally observed this and a further 41 per cent suspect this has occurred.
The next highest risk is for the provision of unequal information in a tender process (64% consider this to be a ‘high’ or ‘medium’ risk), with 10 per cent having personally observed this and a further 35 per cent suspecting it has occurred.
Suppliers who have tendered for work in the construction and commercial sectors are significantly more likely to have either observed or suspected these behaviours are occurring, particularly in relation to certain suppliers being favoured when awarding a contract (66% across both sectors).
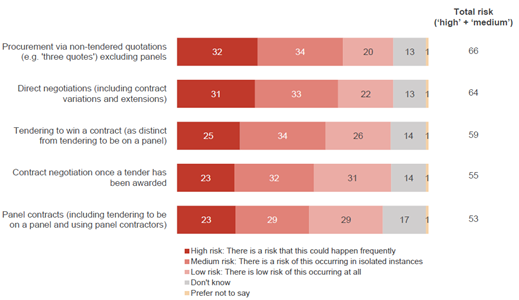
The majority of suppliers consider there is at least a ‘medium’ risk of improper behaviour regardless of the type of procurement method used.
The greatest risk of improper behaviour occurring is associated with procurement via non-tendered quotations (e.g. ‘three quotes’), where 66 per cent of suppliers rate the level of risk as ‘high’ or ‘medium’. Just over half of all suppliers rated the risk of panel contracts (53%) at the same level.
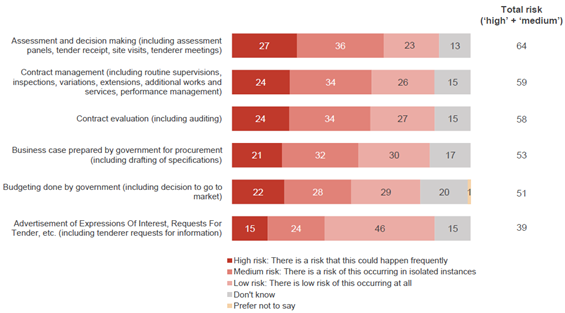
Assessments, contract management and evaluation are considered the most at risk of corrupt procurement process behaviours.
The greatest risk of improper behaviour occurring during the procurement process was identified by suppliers during the assessment and decision-making process – 64 per cent rated this as a ‘high’ or ‘medium’ risk. Approximately 60 per cent rated the contract management and contract evaluation stages as ‘high’ or ‘medium’ risks.
Most suppliers have been provided with information about expected standards of conduct or business ethics and mostly consider it easy to understand, relevant and useful.
Sixty-five per cent of suppliers confirmed they were provided with information about the expected standards of conduct or business ethics from public sector agencies and almost all (98%) reported understanding this information. Seventy-nine percent agree the information was relevant and up-to-date and 74 per cent agree that it was useful.